[text]
Technical Analysis of EUR/AUD Dates 2014.12.17
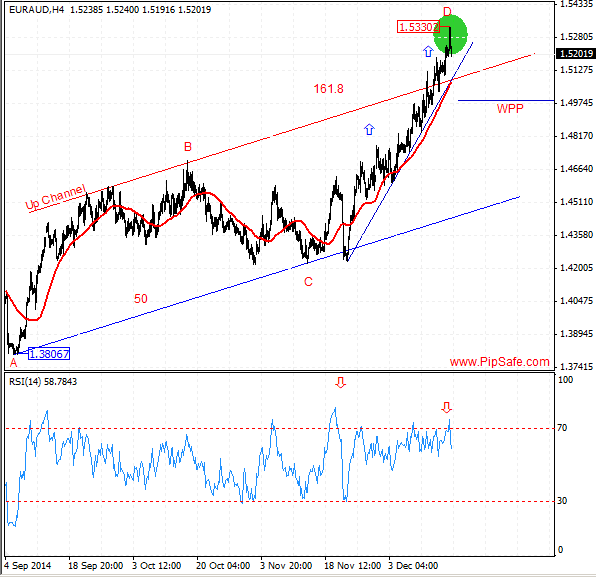
EUR/AUD was in a strong and consistent uptrend during the recent weeks that Buyers were successful in obtaining the highest price of 1.53302.Currently price in long term time frames such as monthly and weekly is above 5-day moving average and warns more ascending in long term interval.As it is obvious in the picture below, between the top price of 1.53302 and bottom price of 1.38067 there is AB=CD harmonic pattern with ratios of 50 and 161.8 that warns the potential of descending from the D point of this pattern.
RSI indicator is in saturation BUY area in h4 and daily time frames and in divergence mode with the price chart that warns about changing price direction during the next days.According to the current situation there is not any clear reason about descending of price in long term time frames such as monthly,weekly and daily. The least sign for descending of price is formation of a top price and recording of it in daily time frame.
Written by the technical team of PipSafe Company
EUR/AUD Chart dated 2014.12.17
[/text]
Categories :
Tags : AUD eur EUR/AUD EUR/AUD News forex bonus without deposit Forex Broker forex broker bonus forex learn forex learning forex learning pdf forex tutorials for beginners pdf how to trade forex for beginners pdf learning forex trading pdf RSI


