[text]
EUR/GBP Technical Analysis 17 April ,2015
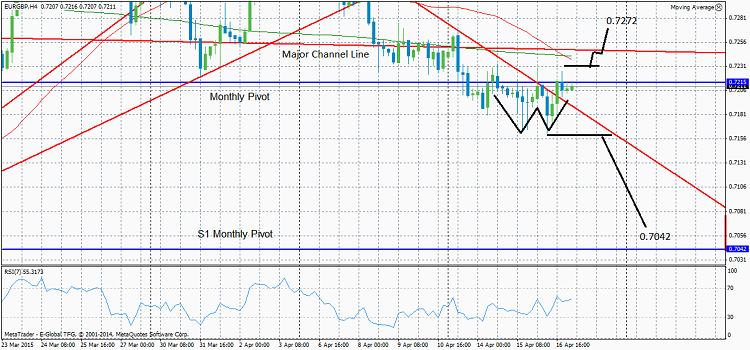
The EUR/GBP pair has formed what looks like a double bottom reversal pattern right on support from the monthly pivot at 0.7200. This is also just below a major channel line drawn on the monthly chart connecting the lows in 2010 and 2012. This line has so far prevented a further slide down for the pair which has been in a down-trend for the last year and a half.
There is quite a lot of resistance above the double bottom,including the channel line at 0.7247. Nevertheless, I think there is a chance this could be overcome on a break higher, for example, if the pair moved above the neckline at 0.7234, which would produce a target at 0.7272 the 61.8% Fibonacci extension of the height of the double bottom. Nevertheless the channel line in the middle makes this a risky trade.
Alternatively, there is a chance the down-trend could continue to extend lower. If the pair broke below the double-bottom lows at 0.7162 that would confirm the pattern had failed, and lead to a sudden breakdown lower, with a probable initial target at the S1 monthly pivot at 0.7042.
EUR/GBP Chart
[/text]
Categories :
Tags : EUR/GBP Forex Forex Market Analysis Forex4you


