[text]
Gold Analysis (2015.05.05)
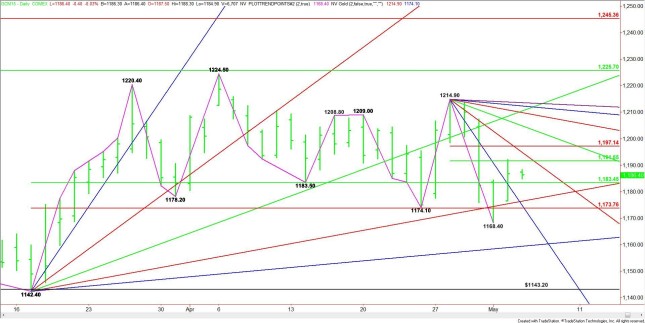
June Comex Gold futures rallied on Monday, but found resistance at a short-term 50% level. There hasn’t been a follow-through move to the upside during the pre-market session and after the RBA rate cut which is a sign that yesterday’s rally was likely short-covering triggered by technically oversold conditions.Volume is expected to be below average this week because of the U.S. Non-Farm Payrolls report on Friday. Therefore, the market may be susceptible to periods of sideways action, followed by spike moves.
The main trend is down on the daily chart. The main range is $1142.40 to $1224.50. Its retracement zone is $1183.40 to $1173.70. Although the lower, or Fibonacci level was taken out on May 1, the close was inside the zone. This area remains strong support along with an uptrending angle passing through the zone at $1176.40 today.There is a cluster of numbers at $1176.40, $1274.90 and $1173.70. This area should be considered support and a trigger point for an acceleration to the downside. If $1173.70 fails as support then look for a break into $1168.40, followed by $1159.40.
The short-term range is $1214.90 to $1168.40. Its retracement zone and primary upside target is $1191.70 to $1197.20. A downtrending angle passes through this zone at $1194.90, making it a valid upside target.The trigger point for a possible acceleration to the upside is the Fibonacci level at $1197.20. The target over this level is $1204.90.Trading between two 50% levels at $1191.70 and $1183.40 as well as inside a triangle bounded by $1194.90 and $1176.40 is a sign of trader indecision. Although it is possible, I’d be surprised if investors committed one way or the other before Friday’s U.S. jobs report. Because of the light volume, there may be pockets of volatility which could lead to spike moves so don’t get caught napping.
Gold CHART
[/text]
Categories :
Tags : binary options trader Gold Gold Analysis Gold NEWS


