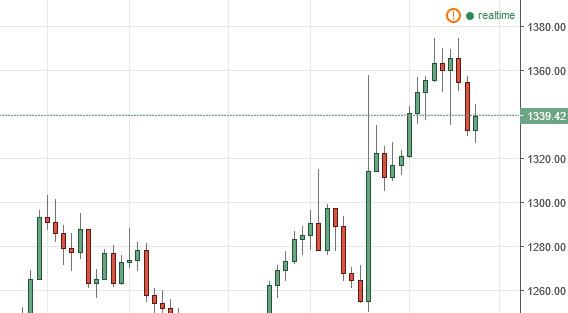
Gold Technical Analysis – The gold markets went back and forth during the course of the session on Wednesday, as the $1325 level offered enough of a bounce to form a relatively supportive looking candle. If we can break above the top of the candle for the session on Wednesday, this market should continue to go much higher, and perhaps try to reach towards the highs yet again. At this point in time, it’s likely that the markets will continue to find buyers below, as so many currencies are definitely toxic at this point in time. Gold will continue to be a shelter from European issues.
Gold Chart
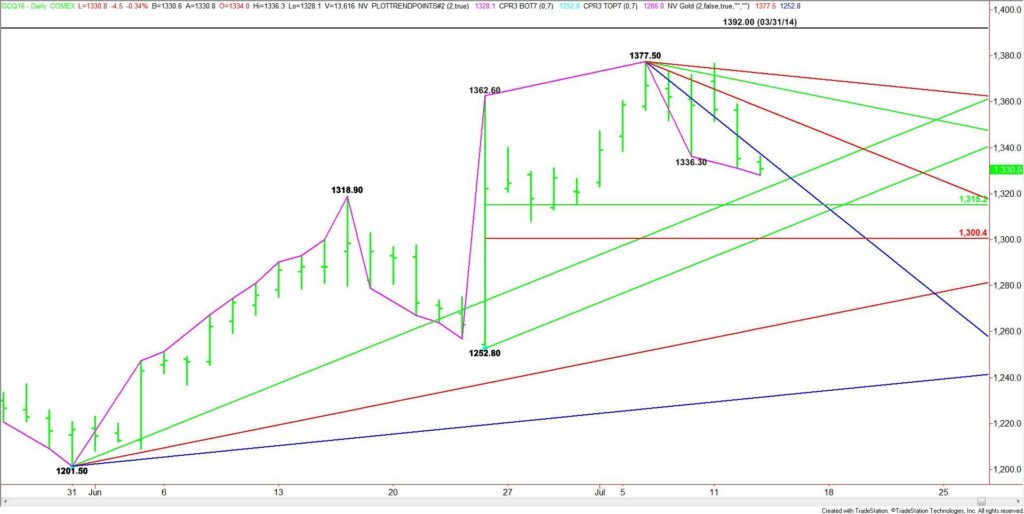
August Comex Gold futures broke sharply on Tuesday, signaling a major shift in momentum to the downside. The strong stock market is hurting gold prices because it is drawing investors away from the asset. With stocks erasing their post-Brexit losses, it appears that gold investors who bought the precious metal against uncertainty have decided to take profits after a long rally.The main trend is up according to the daily swing despite the loss of momentum. The uptrend will resume on a trade through $1377.50 and turn down on a trade through $1252.80.The main range is $1252.80 to $1377.50. Its retracement zone at $1315.20 to $1300.40 is the primary downside target. An uptrending angle passes through this zone at $1300.80, making it a valid downside target also.
Based on Tuesday’s close at $1335.30 and the early price action, the direction of the market today is likely to be determined by trader reaction to the downtrending angle at $1337.50.A sustained move under $1337.50 will indicate the presence of sellers. This could create enough downside momentum to challenge the long-term uptrending angle at $1321.50. This is followed by the 50% level at $1315.20.Taking out $1315.20 could trigger an acceleration to the downside with the next target the support cluster at $1300.80 to $1300.40.A sustained move over $1337.50 will signal the presence of buyers. This is the trigger point for an acceleration to the upside with the next target angle coming in at $1357.50.Watch the price action and read the order flow at $1337.50. Trader reaction to this angle will determine the direction of the gold market today.
Source: FXEMPIRE
Categories :
Tags : binary options trader Comex Gold futures Gold Chart gold markets Gold Technical Analysis


