AUD/USD Forex Technical Analysis(2015.11.30)
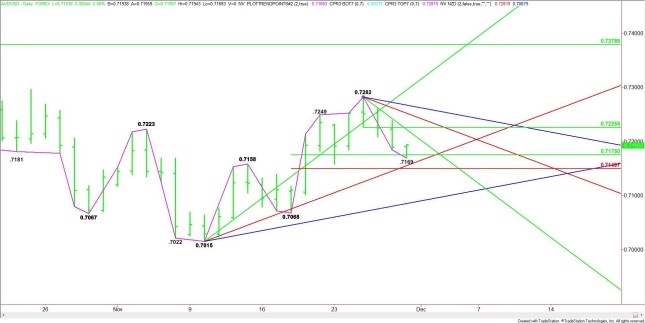
The AUD/USD is trading flat after recovering from an early session setback. Buyers came in after the market entered a short-term retracement area. This sets up the Aussie for a near-term retracement to the upside. This move will set up a possible secondary lower top which should determine the next major move in the market.
AUD/USD Chart
The main trend is up according to the daily swing chart. The main range is .7068 to .7282. Its retracement zone is .7175 to .7150. Earlier in the session, the AUD/USD tested the zone when it traded at .7169. The subsequent rally indicates that buyers came in to defend the trend. This move may have been fueled by a combination of profit-taking, short-covering and speculative buying.
Based on Friday’s close at .7189, the first support is the 50% level at .7175. This is followed by an uptrending angle at .7155 and a Fibonacci level at .7150. The daily chart opens up to the downside on move under .7150 with the next potential target another uptrending angle at .7085.
A sustained move over .7189 will indicate the presence of buyers. The first upside target is a downtrending angle at .7222. This is followed by a short-term 50% level at .7225 and another downtrending angle at .7252.
After the earlier rebound rally from a successful test of the retracement zone at .7175 to .7150, watch the price action and read the order flow at .7189. Trader reaction to this price should determine the tone of the market into the close. The best upside target is .7222 to .7225. Trader reaction to this zone should determine the next major move by the AUD/USD.
Source: FXEMPIRE
Categories :
Tags : AUD/USD AUD/USD Chart binary options trader forex bonus without deposit Forex Broker forex broker bonus forex learn forex learning forex learning pdf Forex News forex tutorials for beginners pdf how to trade forex for beginners pdf learning forex trading pdf News


