[text]
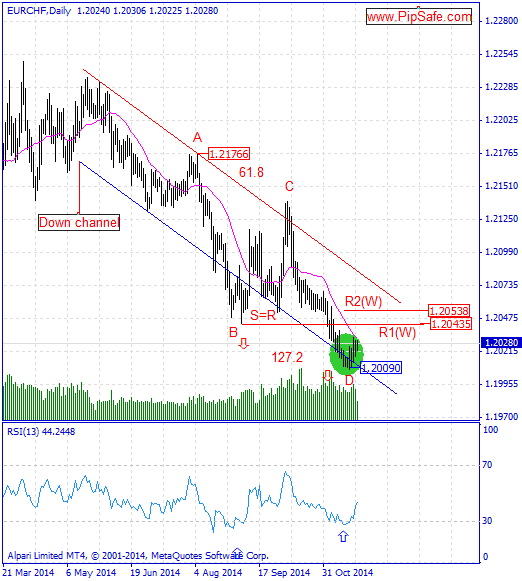
EUR/CHF during the recent month was in a downtrend that sellers were successful in achieving the lowest price of 1.20090.With cashing of some sellers’ trades (formation of candlestick pattern such as Spinning top and Inverted Hammer in weekly time frame) the price ascends and currently with closing of bullish candle on 21th records the bottom price of 1.20090.As it is obvious in the picture below between the top price of 1.21766 and bottom price of 1.20090, there is AB=CD harmonic pattern with the ratios of 61.8 and 127.2 that warns about the potential for ascending of the price.
RSI indicator is in saturation sell area and in divergence mode with the price chart in daily time frame that confirms the bottom price of 1.20090 and warns about changing price direction.Generally according to the formed signs in price chart, until the bottom price of 1.20090 is preserved; price will have the potential for increasing and ascend.
Technical Analysis of EUR/CHF Dates 2014.11.25
EUR/CHF Technical Analysis
Written by the technical team of PipSafe Company
[/text]
Categories :
Tags : chf eur EUR/CHF Forex forex bonus without deposit Forex Broker forex broker bonus forex learn forex learning forex learning pdf forex tutorials for beginners pdf how to trade forex for beginners pdf learning forex trading pdf News


