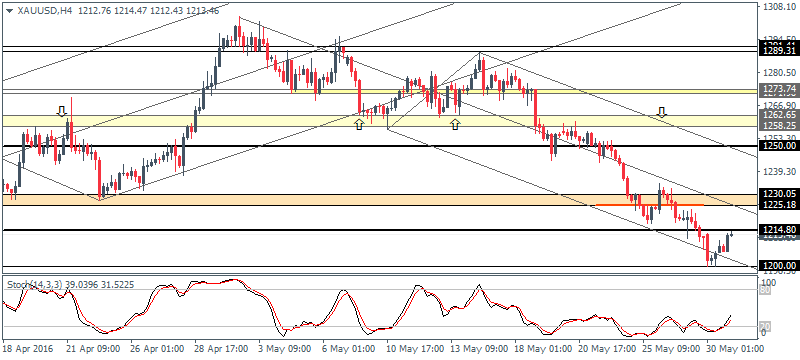
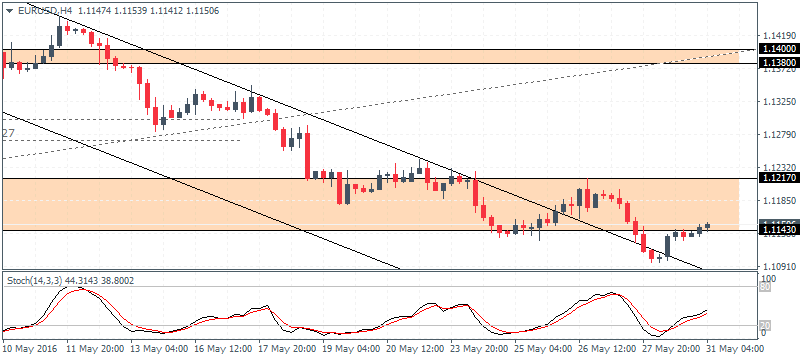
Short term bottom established in EURUSD and Gold – The markets were slow yesterday with the US and the UK closed, but Gold prices continued to slide lower. With the $1200 psychological level holding out so far, we expect a near term bottom in place with gold prices likely to correct higher. EURUSD is also showing signs of exhaustion to the downside for the moment with 1.130 as the next level of resistance that could be targeted.
EURUSD Daily Analysis
EURUSD (1.115): EURUSD closed with a modestly bullish note yesterday following the strong bearish candlestick on Friday. The reversal is likely to see a near term retracement in prices, with 1.120 price level coming in as the first level that could be tested for resistance. On the 4-hour chart, price action is currently flat with a moderate rally in prices. The Stochastics has moved out of oversold levels. Only a clean break above 1.120 – 1.12170 and establishing support at this level will see further upside towards 1.1380 resistance zone.
USDJPY Daily Analysis
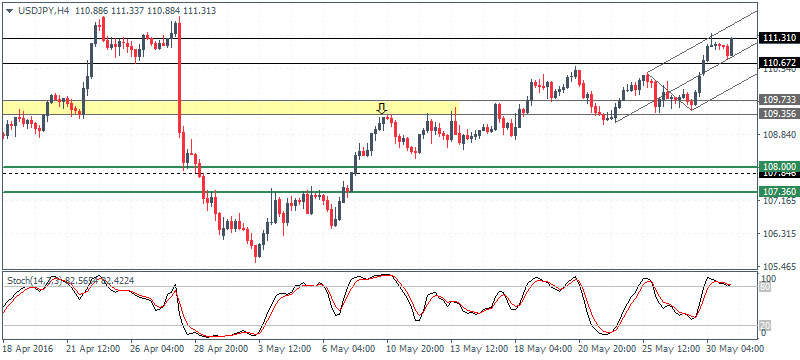
USDJPY (111.3): USDJPY continues to edge higher with price action now aiming for the 111.43 – 112.0 level of resistance. Unless prices go for a clean break above this resistance level USDJPY could be looking for a dip towards 107.95 – 108.0 support on a retracement. The 4-hour chart shows prices in the resistance zone currently with the Stochastics pointing to a hidden divergence near this resistance. 109.73 -109.35 will be the first support level of interest to the downside ahead of a correction to 108.
GBPUSD Daily Analysis
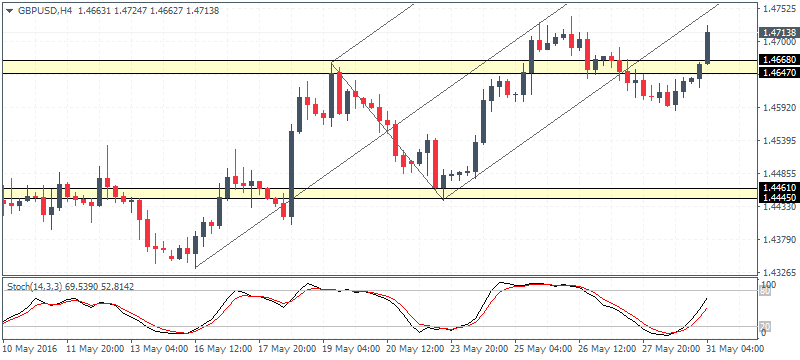
GBPUSD (1.471): GBPUSD is currently bullish, but prices are in the resistance zone of 1.4743 – 1.4720. Further continuation to the upside is possible only on a close above 1.4743 with a bullish candlestick pattern confirming further upside in prices. Support at 1.4461 – 1.4445 will be likely holding out any short term dips. Above 1.4743, the next resistance is at 1.48.
Gold Daily Analysis
XAUUSD (1213): Gold prices fell through to test the 1200 support yesterday and with prices holding at this support so far, a near term rally cannot be ruled out. 1231.50 is the first level of resistance to the correction followed by 1264. On the 4-hour chart, 1214.80 is likely to act as a minor resistance level, and only a break above this resistance will see a continuation to the upside. To the downside, 1200 support could be tested if the 1214.80 resistance holds, but price action could stay flat. A break below 1200 could see gold prices fall towards 1180 – 1190 region.
Source: Orbex Forex Broker (Review and Forex Rebates Up to 85%)
Categories :
Tags : EUR/USD forex bonus without deposit Forex Broker forex broker bonus forex learn forex learning forex learning pdf forex tutorials for beginners pdf Gold how to trade forex for beginners pdf learning forex trading pdf Stochastics pointing


