EURUSD looks to Draghi for policy clues – Following Tuesday’s weakening in the US dollar, prices were seen stabilizing yesterday with the markets now waiting for the ECB’s press conference. Not much in terms of policy changes are expected, therefore the ECB’s economic projections and QE prospects will be closely watched. EURUSD has formed a potential head and shoulders pattern that is still evolving. A validation of this pattern puts EURUSD at risk of testing 1.0900 support. Meanwhile, GBPUSD is likely to post a lower high following which a correction to 1.3200 is on the cards.
EURUSD Daily Analysis
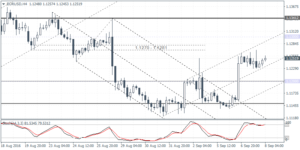
EURUSD (1.1251): EURUSD has formed what looks like a spinning top pattern near the lower high. On the daily chart, price action is also showing a potential head and shoulders pattern with the right shoulder currently formed near yesterday’s high. A bearish follow through here, and a breakdown towards 1.1100 could signal further downside to 1.0900. On the 4-hour chart, price action is showing consolidation near the current levels with resistance at 1.1270 – 1.1280 likely to be tested. As long as prices remain below 1.1300, the daily chart’s head and shoulders pattern could signal further downside.
USDJPY Daily Analysis
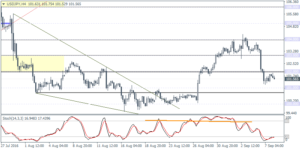
USDJPY (101.56): USDJPY tested an 8-day low to 101.20, but price action is still likely to push lower to test 101.00 – 100.80 support level. A retest here could mark the completion in the correction with USDJPY likely to push higher from here on. To the upside, watch for 104.00 as the initial resistance followed by a test to 106.00 resistance level. To the downside, if USDJPY breaks below 100.80 on a daily basis, the further downside could be seen with a test to 100.00 quite likely.
GBPUSD Daily Analysis
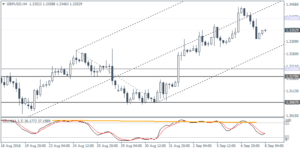
GBPUSD (1.3352): GBPUSD was bearish yesterday with prices forming an inside bar near 1.3400. Failure to breakout to the upside could keep GBPUSD biased to the downside for a test towards 1.3200 support level. On the 4-hour chart price action has broken below 1.3400 after forming a pivotal high near 1.3445. A lower high back to 1.3400 could signal a continuation to the downside targeting 1.3200. In the event that prices break above 1.3400 and threatens the previous high, further upside could be seen.
Gold Daily Analysis
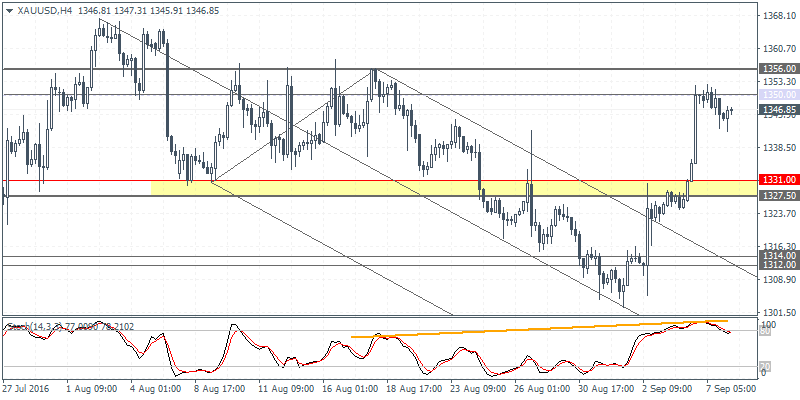
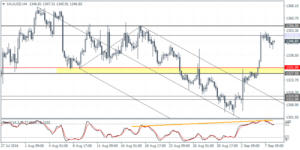
XAUUSD (1346.85): Gold prices pulled back after testing 1350 handle yesterday, and the daily chart price action is showing a descending triangle pattern with the neckline support seen at 1300 – 1315. As long as 1360 is not breached, the bias remains to the downside, in which case further declines could be seen coming. On the 4-hour chart, the hidden bearish divergence continues to remain in play with support at 1331 – 1327.50 likely to be tested in the near term. Also, note the potential inverse head and shoulders pattern that could be formed following the test of resistance at 1356 – 1350 on the 4-hour time frame. A reversal near 1331 – 1327.50 could potentially see gold prices break out towards posting new highs.
Review and Forex Rebates Up to 85%
Categories :
Tags : ECB’s economic EUR/USD EURUSD Daily Analysis forex bonus without deposit Forex Broker forex broker bonus forex learn forex learning forex learning pdf forex tutorials for beginners pdf GBPUSD Daily Analysis Gold Daily Analysis how to trade forex for beginners pdf learning forex trading pdf USDJPY Daily Analysis


