[text]
Technical analysis of GBP/CAD dated 25.02.2015
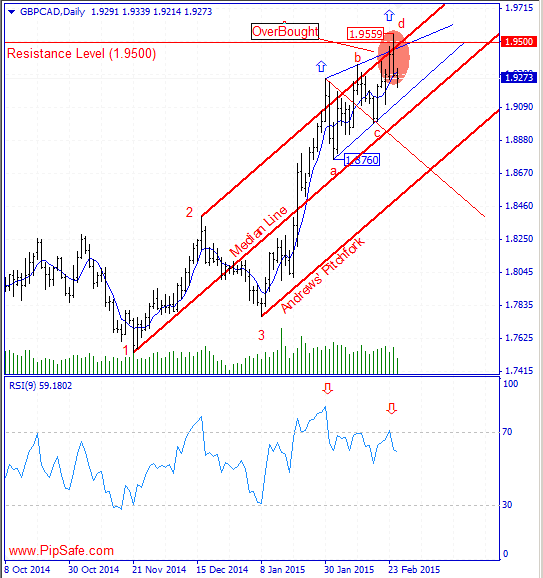
GBP/CAD in recent weeks has a strong ascending trend that shows the serious buyers in reaching to their target prices. The price during this ascending trend could record the top price of 1.9559 that is the most important resistance level in front of price.According to the formed movements in daily chart of this currency pair, there is AB=CD harmonic pattern with none-ideal ratios of 61.8 and 127.2 between bottom price of 1.6760 and the top price of 1.9559 that by completion of the D point in this pattern, there is warning for descending of the price and changing price direction.
Formation of the Higher long shadow in the last day candle shows the failure of buyers in reaching to the higher prices. RSI indicator is in saturation buy area and in divergence mode with the price chart in daily time frame that confirms the price level of 1.9559 and warns changing price direction during the next candles.Generally according to the formed signs in this price chart, until the top price of 1.9559 is preserved, there will be the potential for descending and price reformation in this currency pair.
Written by the technical team of PipSafe Company
GBP/CAD Chart
[/text]
Categories :
Tags : Analysis forex bonus without deposit Forex Broker forex broker bonus forex learn forex learning forex learning pdf forex tutorials for beginners pdf GBP/CAD gbp/cad chart how to trade forex for beginners pdf learning forex trading pdf News


