[text]
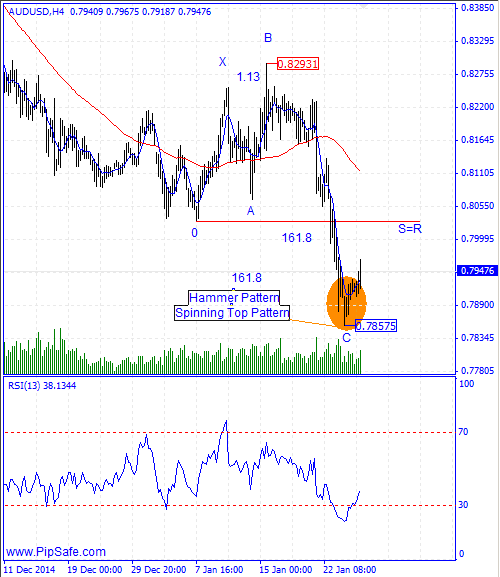
AUD/USD was in a strong and consistent downtrend during the recent days that sellers were successful in obtaining the lowest price of 0.78575.This bottom price has stabilized by closing of yesterday ascending candle (Daily Chart) and it is the nearest supportive level.
According to the formed price movements in the chart, there is a Shark harmonic pattern between the bottom price of 0.78575 and top price of 0.82931 that warns about ascending of the price with completion of this pattern ending point.
In daily and h4 time frames RSI indicator is in saturation sell area and with the next cycle confirms the bottom price of 0.78575. Generally according to the current situation, until the bottom price of 0.78575 is preserved, there is the potential for ascending of price and reformation of descending trend.
Written by the technical team of PipSafe Company
AUD/USD Chart
[/text]
Categories :
Tags : (Daily Chart) AUD/USD AUD/USD Chart forex bonus without deposit Forex Broker forex broker bonus forex learn forex learning forex learning pdf Forex Market Analysis Forex Market News forex tutorials for beginners pdf how to trade forex for beginners pdf learning forex trading pdf Shark harmonic pattern


