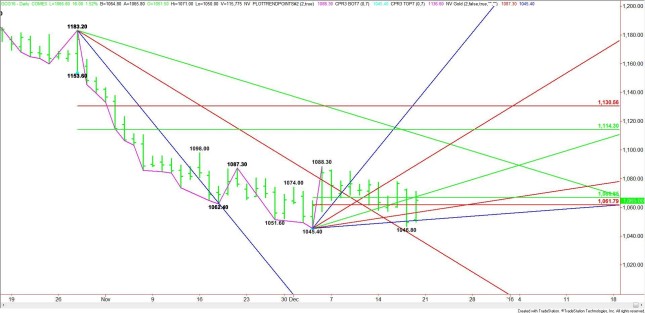
February Comex Gold futures closed higher on Friday after surviving a test of the main bottom at $1045.40. A trade through this bottom would’ve signaled resumption of the downtrend.
The main trend is up according to the daily swing chart. The trend turned up on December 4, but momentum has been to the downside since that date.The short-term range is $1045.40 to $1088.30. Its retracement zone is $1066.90 to $1061.80. The market had been straddling this zone for two weeks. Trader reaction to this zone is likely to set the tone of the market over the near-term.
Based on Friday’s close at $1065.00, the direction of the market today is likely to be determined by trader reaction to the 50% level at $1066.90 and the Fibonacci level at $1061.80.A sustained move over $1065.00 will indicate the presence of buyers. Crossing over to the strong side of the up trending angle at $1069.40 will put gold in a bullish position. The daily chart is open to the upside over this angle with the next target the December 4 high at $1088.30 and the steep up trending angle at $1093.40.Crossing to the strong side of the angle at $1093.40 will put gold futures in a position to challenge a long-term down trending angle at $1109.20 and a long-term 50% level at $1114.30.
A sustained move under the Fib level at $1061.80 will signal the presence of sellers. The first downside target is an uptrending angle at $1057.40. This is followed closely by another uptrending angle at $1051.40. This is the last potential support angle before last week’s low at $1046.80 and the main bottom at $1045.40.Taking out $1045.40 will negate the closing price reversal chart pattern and signal a resumption of the downtrend. The first target under this bottom is a long-term downtrending angle at $1035.20. Crossing to the weak side of this angle will put gold in an extremely bearish position.
Source: FXEMPIRE
Categories :
Tags : binary options trader Gold Gold Analysis Gold Chart


