[text]
Gold
Gold Technical Analysis
After a prolonged move down in terms of price and time, April Comex Gold futures posted a higher close on Wednesday. Friendly comments from Federal Reserve Chair Janet Yellen at her testimony before Congress, a weaker U.S. Dollar, and the return of Chinese investors following the week-long Lunar New Year, helped boost prices.With the Fed Chair sounding dovish and without revealing any specific date for an interest rate hike, support may begin to form for gold. Increased volume and volatility could be right around the corner with the return of Chinese capital. Low prices and oversold conditions could also attract fresh buyers.
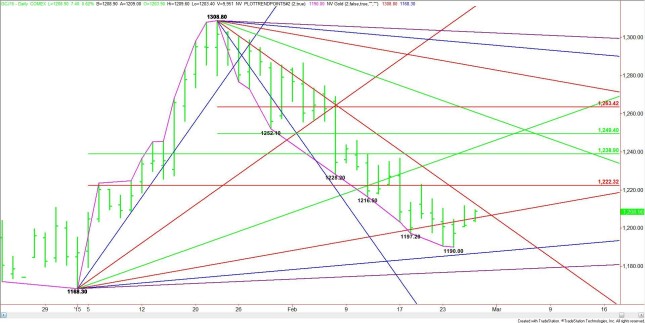
Technically, despite the break from $1308.80 to $1190.00, the main trend never turned down on the daily swing chart. Instead, gold found support near an angle from the main bottom at $1168.30. This angle moves up to $1186.80 today.The key uptrending angle to watch comes in at $1205.30. Overcoming and holding this angle could trigger a short-covering rally into the major, long-term downtrending angle at $1212.80. This price is the trigger point for a potential breakout into the Fibonacci level at $1222.30.
If a rally begins to gain traction then the primary target becomes $1249.40 to $1263.40 over the near-term. It looks as if March 5 is the best timing for a move into this zone. The timing of the move will depend on the volume, however, and how fast fund traders are willing to cover their positions. A weaker dollar and strong crude oil will also help fuel a rally.On the downside, a failure at $1205.30 will mean that gold isn’t ready to rally yet. This could lead to a pullback into or slightly above $1190.00.The tone of the market today will be determined by trader reaction to $1205.30. This is the most important price of the day.
Gold Chart
FXEMPIRE
[/text]
Categories :
Tags : binary options trader Chart Comex Gold futures Gold News


