[text]
Silver Technical Analysis April 14 ,2015
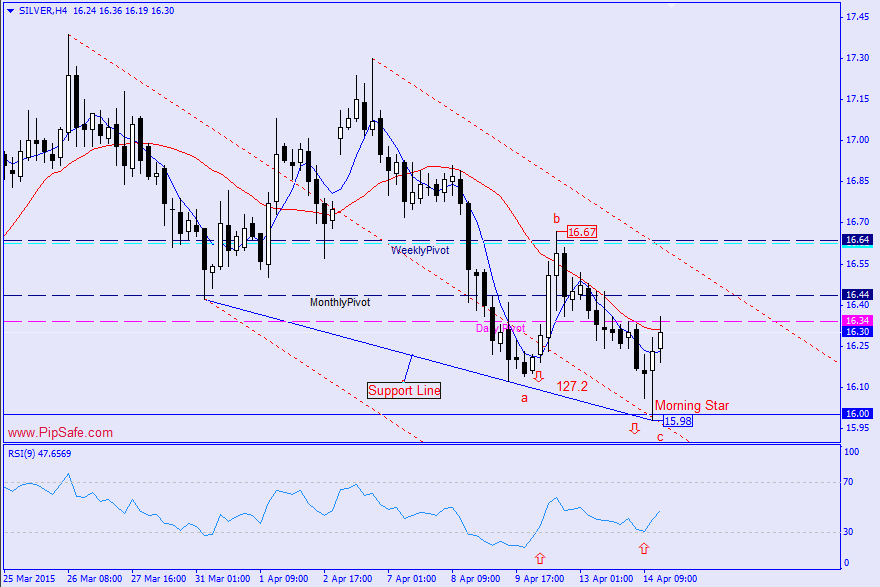
Silver chart has experienced a descending trend during the recent day that could record the bottom price of 15.98.Price during the descending has touched the Support line (made of 2 bottom prices) and also the round supportive level of 16.00 and has created the morning star candlestick pattern. Closing of the bullish candle after this pattern will confirm it and warns about ascending of price.
As it is obvious in the picture below, between the top price of 16.67 and bottom price of 15.98 there is ABC harmonic pattern with ratio of 127.2 that warns the potential of ascending from the C point of this pattern. RSI indicator is in saturation sell area in H4 time frame and in divergence mode with the price chart that warns about changing price direction during the next candles.Generally until the bottom price of 16.00 is preserved, there is a potential for price reformation in this Metal.
Written by the technical team of PipSafe
Silver Chart
[/text]
Categories :
Tags : AB=CD harmonic ABC Silver


